Helped 17 service businesses win more demand and convert it by increasing visibility, selling more estimates and delivering excellence.
Snapshot
Client: 17 service-based small businesses (names redacted)
Year: 2019
Role: Business Consultant & Coach
Focus areas: Sales systems, marketing execution, estimate process, project management, service delivery, recruiting support
Engagement window: Week 4–35 (delivered in phases)

Key outcomes (tracked during the engagement year):
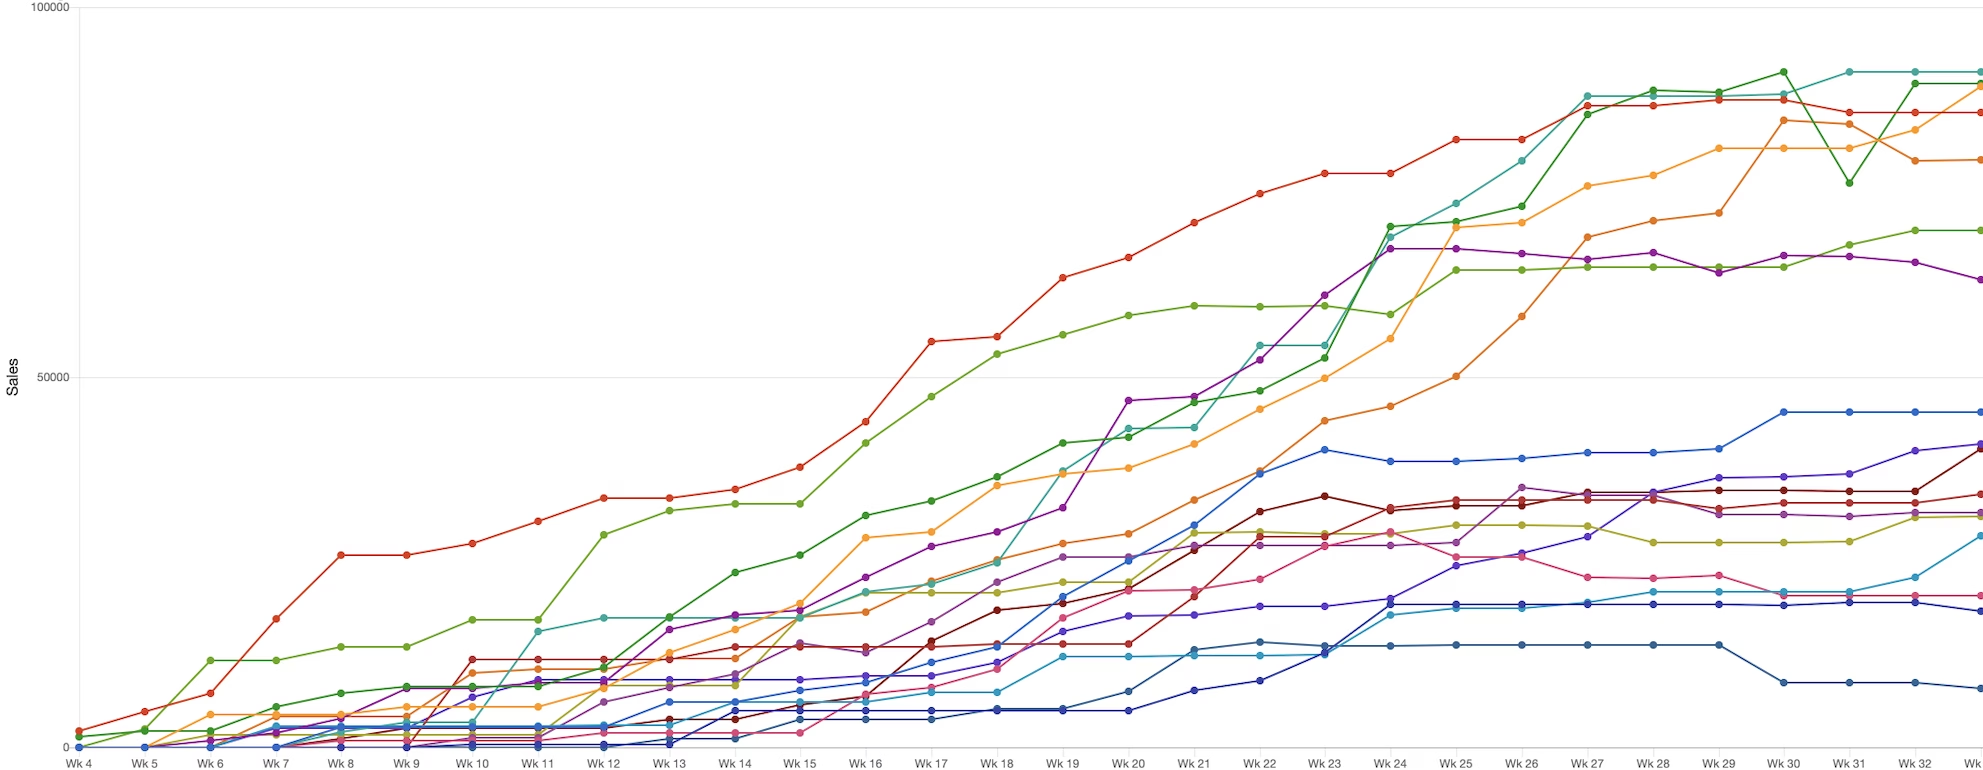
- $860,558 in extra sales
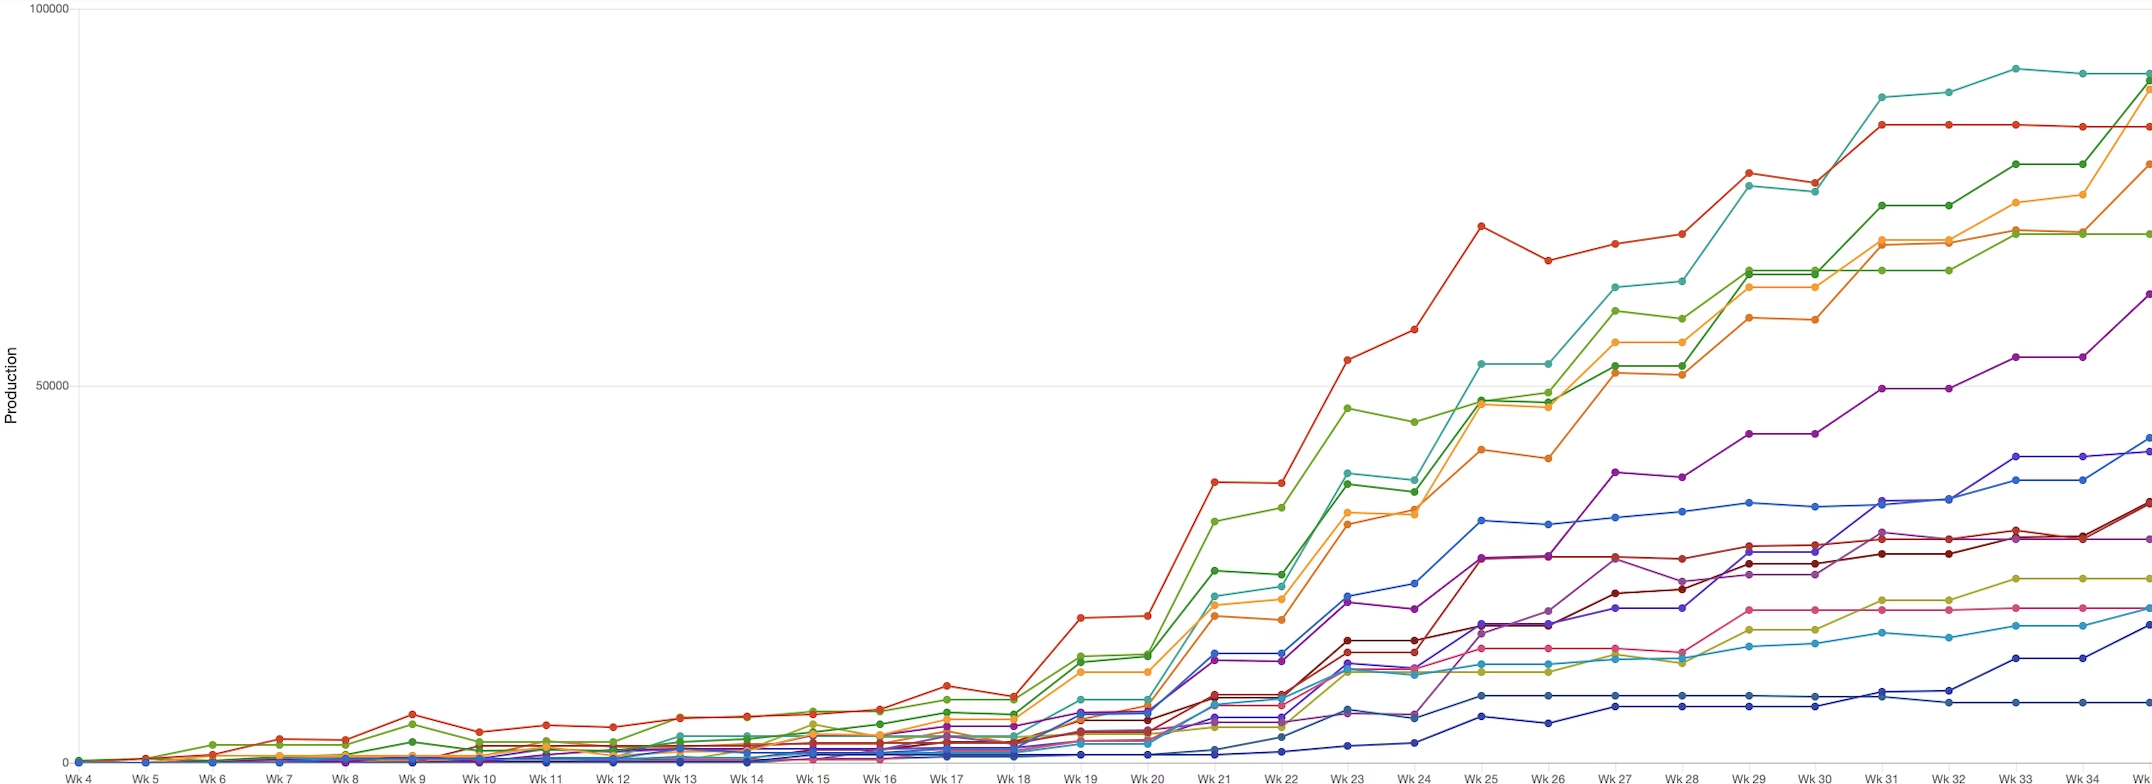
- $860,042 in added production fulfilled
- 1,076 estimates completed
- 441 jobs sold from estimates (~41% close rate)
The Problem
The pattern was consistent across the group:
- Not enough leads / exposure in their local markets
- Not enough sales relative to where they expected to be
- Minimal tracking prior to onboarding (so decisions were driven by gut feel, not numbers)
Most service businesses don’t lose because they’re “bad at marketing.” They lose because the pipeline isn’t managed end-to-end:
Visibility → Lead Handling → Estimate Process → Sold Work → Fulfilled Projects
The Diagnosis: Where Service-Business Growth Breaks
The breakdown usually happens in one (or more) of these places:
- Visibility (not enough qualified inbound demand)
- Conversion (leads/estimates not turned into sold jobs consistently)
- Delivery (fulfillment issues that damage reviews, referrals, and repeat business)
So the goal wasn’t “get more leads”, it was to build a dependable revenue pipeline.
What We Changed (The Playbook)
This engagement was executed in phases so we could fix the pipeline in the right order.
Phase 1 — Sales & Marketing (Weeks 4–33)
- Installed consistent lead handling + follow-up expectations
- Strengthened the estimate process (scripts, objection handling, next steps, speed-to-lead)
- Implemented basic tracking habits so owners could see the funnel clearly
- Supported marketing execution where needed (including content + paid/social support)
Phase 2 — Customer Experience + Production (Weeks 18–35)
- Improved customer communication and expectation-setting
- Standardized project management and job completion workflows
- Reduced service-delivery friction (protects reviews and referral momentum)
Phase 3 — Owner Coaching + Team Support (throughout)
- Weekly accountability and performance coaching
- Recruiting/training guidance to support growth
- Operational planning so owners weren’t “buying a job” while scaling
Results (What the Numbers Show)
Because many clients weren’t tracking metrics prior to onboarding, results are reported from the tracked period during the engagement year.
Across 17 businesses in 2019:
- Booked Sales: $860,558
- Production Fulfilled: $860,042
- Estimate Volume: 1,076 total estimates
- Close Rate: 441 sold / 1,076 estimates = ~41%
The trend charts show consistent ramping across the year in sales and production, with growth accelerating after the consulting phases began (Weeks ~4–22 onward).
Why It Worked
This worked because it treated growth like a system and not a tactic.
- Pipeline clarity: tracking + accountability created visibility into what to fix
- Conversion improvements: sales process + follow-up made demand more profitable
- Fulfillment stability: project management + service completion protected reputation and referrals
In service businesses, reputation compounds. Delivery quality protects the growth you create.
Call to Action
If you run a local service business and you feel stuck in inconsistent lead flow, unclear conversion, or delivery stress, this is exactly what I help fix.
Book a quick Discovery Call and I’ll show you the first 2–3 levers that will create the biggest impact.